PostgreSQL Geodatabase Query Performance
Posted: December 18, 2014 Filed under: DBMS Administration | Tags: administration, data management tools, geodata, geodatabase, PostgreSQL Leave a commentI came across a couple things that might be helpful when troubleshooting PostgreSQL geodatabase performance issues. The topics below focus on troubleshooting SQL queries. To get SQL queries from ArcGIS with a PostgreSQL geodatabase, use the instructions found below to set up a trace. Try to isolate the operation by running only the tools or functions needed to cause the behavior in question. This prevents the trace file from filling up with unnecessary information.
To enable PostgreSQL traces to capture ArcGIS/ArcSDE behavior, make a backup of your postgresql.conf file and alter the following parameters:
    log_min_duration_statement = 25
    log_duration = on
    log_line_prefix = '%t [%p]: [%l-1] '
    log_statement = 'all'
    ;stats_start_collector = on #8.3 and earlier
Getting Started:
A good way to approach a slow query is to get an explain plan. This allows one to get a good idea of what the Postgres query optimizer thinks should happen. This can be compared to what was observed. Like Oracle and SQL Server, it is possible to get the query estimation without running the query. Append EXPLAIN ANALYZE to your query get that information:
ortega=# \x
Expanded display is on.
ortega=# EXPLAIN ANALYZE SELECT objectid, parcelid, bearing, distance FROM mtfabric_lines;
Results in…
QUERY PLAN
----------------------------------------------------------------------------------------------
Seq Scan on mtfabric_lines  (cost=0.00..746992.69 rows=12311469 width=1371)
 (actual time=0.007..1369.557 rows=12311469 loops=1)

Total runtime: 1728.851 ms

(2 rows)
Keep in mind these are estimations and many factors go into these results. Having said that, we see a SELECT statement on a very large table (12 million rows) results in a seq scan (full table scan). No indexes are used to filter the results. This is interesting because I know there is a primary key index on the objectid column and a non-unique index on parcelid among others in that table. If this had been a query captured in a trace from ArcGIS, I would definitely investigate indexes further.
Bigger Picture:
To get a bigger picture of index usage vs seq scans use the query below. This allows one to view table access by index or full scan with an average of rows returned.
SELECT relname, seq_scan, seq_tup_read, idx_scan, idx_tup_fetch,
(seq_tup_read / seq_scan) as avg_results
FROM pg_stat_user_tables
WHERE seq_scan > 0
ORDER BY seq_tup_read DESC;

relname                | seq_scan | seq_tup_read | idx_scan | idx_tup_fetch | avg_results
------------------------+----------+--------------+----------+---------------+----------

mtfabric_parcels       |     1105 |    928038431 |   600019 |     342328080 |   839853

sde_logfile_data       |    49461 |    196097584 |   124536 |      13823200 |     3964

mtfabric_points        |      667 |    157639544 |    99108 |      23464095 |   236341

mtfabric_lines         |      619 |    135436559 |  1970843 |    1195065528 |   218798

sde_state_lineages     |  5656437 |     25287996 |  2526745 |       2685002 |        4

mtfabric_jobobjects    |      420 |     14624687 |   117776 |        159958 |    34820

sde_table_registry     |   203217 |     13996463 |      948 |           946 |       68

bloomfieldy_lines      |      324 |      5966692 |   154259 |        569389 |    18415

sde_spatial_references |     1075 |      5823066 |    14505 |         14505 |     5416

d74                    |      248 |      4412565 |   107772 |        117718 |    17792
In the table above, for mtfabric_parcels a seq scan occurred 1,105 times while a scan using an index occurred 600,019 times. This is good considering the average quantity of rows returned is 839,853. This is seen in the avg_results column.
relname                | seq_scan | seq_tup_read | idx_scan | idx_tup_fetch | avg_results
------------------------+----------+--------------+----------+---------------+----------

mtfabric_parcels       |     1105 |    928038431 |   600019 |     342328080 |   839853
The other side of this coin are the stats from the sde_state_lineages table. This table sees a lot of action in a versioned environment. Reading the state_lineages stats row from left to right looks horribly inefficient until we get to avg_results. While it’s true that the state_lineages table is accessed by a full scan 3 million more times than by an index, the average quantity of rows returned is 4. Literally just 4. Whatever the SQL query used to get those 4 results, the stats show a sequential scan was chosen as the most efficient route and that choice was most likely right each time.
relname                 | seq_scan | seq_tup_read | idx_scan | idx_tup_fetch | avg_results
------------------------+----------+--------------+----------+---------------+----------

sde_state_lineages      |  5656437 |     25287996 |  2526745 |       2685002 |        4
Digging Further:
While the next query requires a bit of initial setup, the results returned can provide a wealth of performance information. Please follow the steps below to set up the pg_stat_statements extension and run the query to list longest running queries in a database.
- Enable the pg_stat_statements extension in your PostgreSQL database (repeat for every database you want this available):
CREATE EXTENSION pg_stat_statements;
- Make a backup of your postgresql.conf file. Open up the original postgresql.conf file, uncomment the shared_preload_libraries entry and add the value ‘pg_stat_statements’.
shared_preload_libraries = 'pg_stat_statements'
- Restart the PostgreSQL service.
- Run the following query:
SELECT * FROM pg_stat_statements ORDER BY total_time DESC;
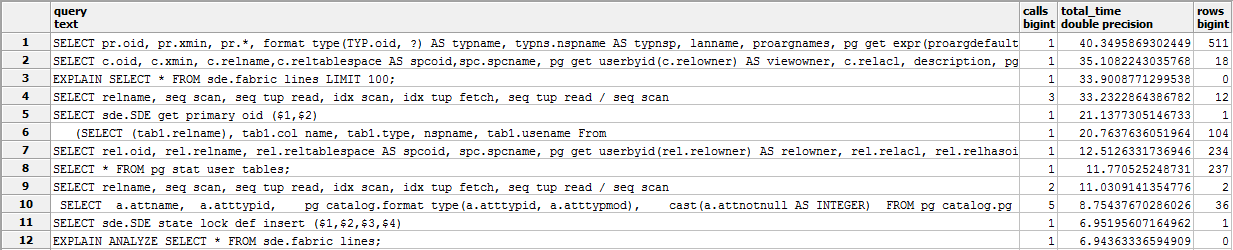
As you can see from the table above, all queries in the database are captured. This can be a great piece of information or too much information. Either way, that information is readily available in PostgreSQL.
